Relocating from Southern California?
The Sacramento Valley is a great place to relocate to. Its central location, affordability, fantastic school systems, and recreational opportunities make it a perfect place to escape the congested roadways and large populations of Southern California.
Affordability
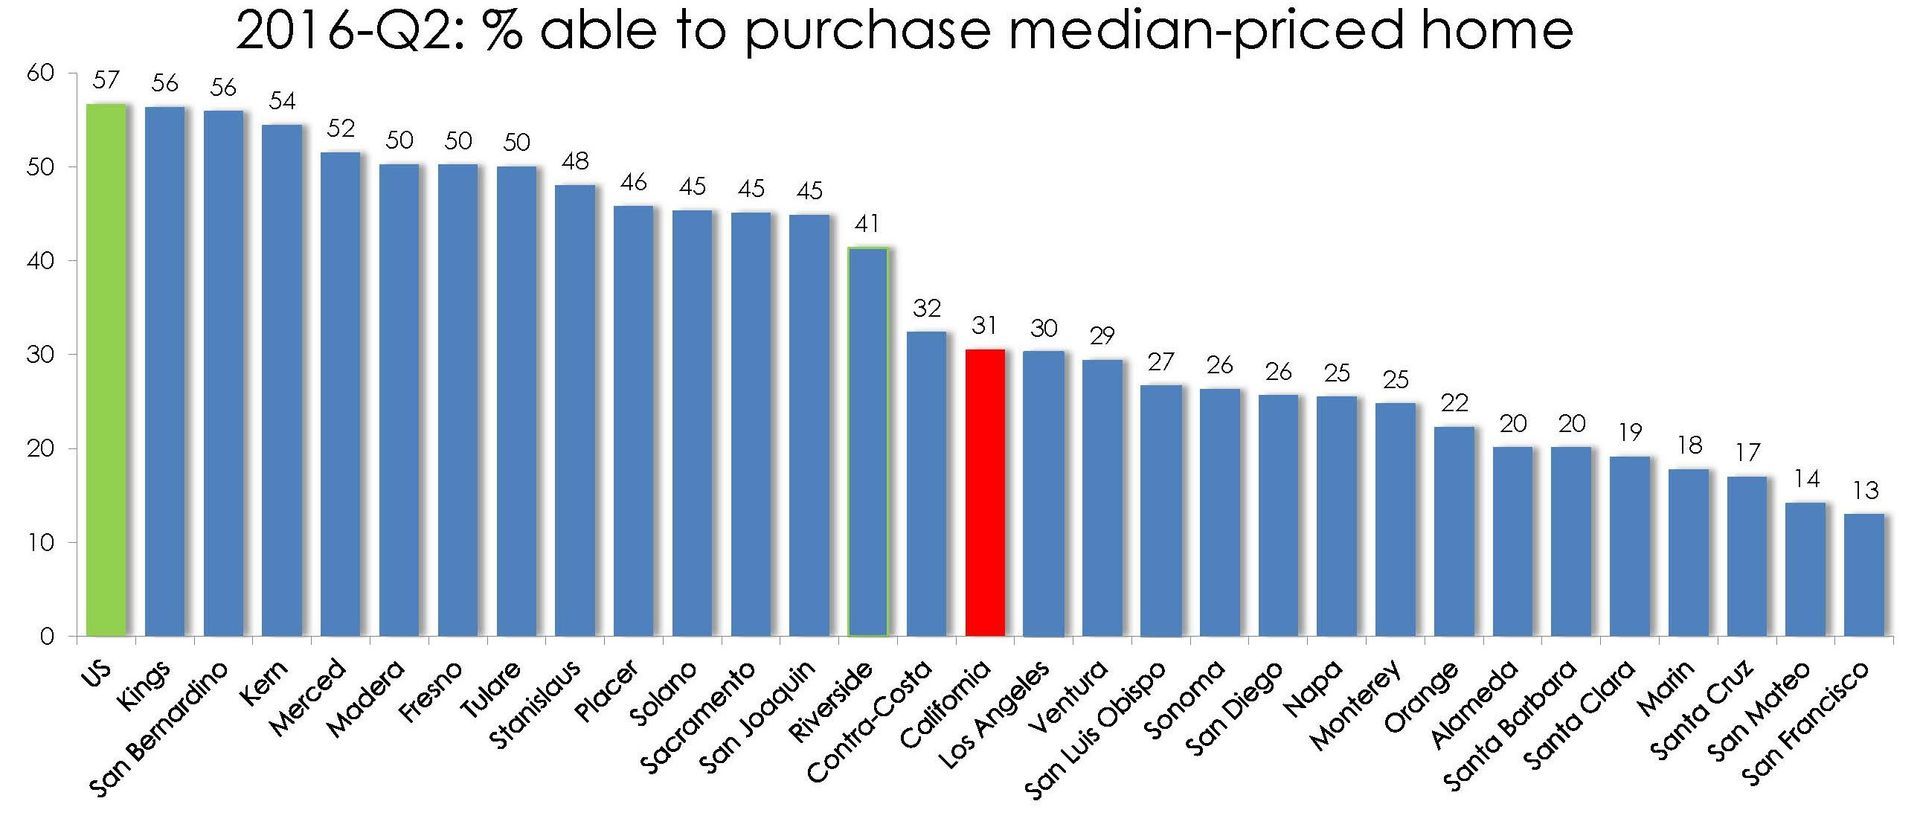
A notable difference between the Sacramento Valley and Southern California is the contrast between affordability and cost of living. In Sacramento County, 45% of people can afford the median priced home versus Los Angeles County (30%) which is just below California as a whole (31%). Some of the other counties in Southern California see an affordability index even below Los Angeles, like Orange at 22% and Ventura (29%) while Sacramento's neighbor, Placer, enjoys a 46% affordability rate.
See the full graph below as presented by C.A.R.

Housing Affordability Index
SOURCE: CALIFORNIA ASSOCIATION OF REALTORS®
A Less Crowded Option
One of the advantages that the Sacramento Area has over Southern California is the population differences. Los Angeles County alone has nearly 675% the population of Sacramento County and the population density is almost 70% more than the latter. Furthermore, Orange County is comparable in size to Sacramento County and has twice the population of Sacramento County. While its population may not seem as large as one would expect, San Francisco is both a city and county, (the entire county is just the city of SF) so its population of 800,000+ is all located within 47 square miles making it by far the most densely populated county.
Of the major cities in California, Sacramento (490,712) is the 6th largest by population. Los Angeles (3,971883) sits at the top of the list with San Diego (1,394,948), San Jose (1,026,908), San Francisco (864,816) and coming in just above Fresno (520,052) rounds out the top 5.
The list below shows the top 30 counties by population. The top 5 counties are all in Southern California, followed by 2 counties from the Bay Area, and finally Sacramento County. Placer County is #22 and El Dorado is #29.
| COUNTY | POPULATION | SQUARE MILES | POPULATION DENSITY |
|---|---|---|---|
| Los Angeles County | 10,170,292 | 4,060 Sq. Miles | 2,505.0 |
| San Diego County | 3,299,521 | 4,204 Sq. Miles | 784.9 |
| Orange County | 3,169,776 | 790 Sq. Miles | 4,012.4 |
| Riverside County | 2,31,026 | 7,208 Sq. Miles | 327.6 |
| San Bernardino County | 2,183,133 | 20,062 Sq. Miles | 106.1 |
| Santa Clara County | 1,918,044 | 1,291 Sq. Miles | 1,485.7 |
| Alameda County | 1,638,215 | 738 Sq. Miles | 2,219.8 |
| Sacramento County | 1,501,5335 | 966 Sq. Miles | 1,554.2 |
| Contra Costa County | 1,126,745 | 720 Sq. Miles | 1,54.9 |
| Fresno County | 974,861 | 5,963 Sq. Miles | 163.5 |
| San Francisco City/County | 864,116 | 47 Sq. Miles | 18,400.3 |
| Ventura County | 850,536 | 1,846 Sq. Miles | 460.7 |
| San Mateo County | 765,135 | 449 Sq. Miles | 1,704.1 |
| San Joaquin County | 726,106 | 1,399 Sq. Miles | 519.0 |
| Stanislaus County | 538,388 | 1,495 Sq. Miles | 360.1 |
| Sonoma County | 502,146 | 1,576 Sq. Miles | 318.6 |
| Tulare County | 459,863 | 4,824 Sq. Miles | 95.3 |
| Santa Barbara County | 444,769 | 2,738 Sq. Miles | 162.4 |
| Solano County | 436,092 | 828 Sq. Miles | 526.7 |
| Monterey County | 433,898 | 3,322 Sq. Miles | 130.6 |
| Placer County | 375,391 | 1,503 Sq. Miles | 249.8 |
| San Luis Obispo County | 281,401 | 3,304 Sq. Miles | 85.2 |
| Santa Cruz County | 274,146 | 446 Sq. Miles | 614.7 |
| Merced County | 268,455 | 1,929 Sq. Miles | 139.7 |
| Marin County | 261,221 | 520 Sq. Miles | 502.3 |
| Butte County | 225,411 | 1,640 Sq. Miles | 137.4 |
| Yolo County | 213,016 | 1.012 Sq. Miles | 210.5 |
| El Dorado County | 184,452 | 1,712 Sq. Miles | 107.7 |
| Imperial County | 180,191 | 4,175 Sq. Miles | 43.2 |
SOURCE: Wikipedia "List of counties in California" and "List of largest California cities by population"
TL;DR
To make a long story short, the Sacramento Area is a great place to get the big city feel but without the big city populations.
Traffic Jams
Traffic is the price residents pay for living in big cities. A quick Google search of worst cities for traffic will heed dozens of list all with Los Angeles in the top 3. Business Insider published their list in March 2016 of the 5 cities that have the worst traffic in America. Number 1 on the list is Los Angeles, estimating that commuters need to allow 43 extra minutes for traffic and waste an average of 6.8 days per year due to congested roadways! The article is based off TomTom Traffic Index which tracks and ranks world traffic in 174 major cities. It lists Los Angeles as the 10th worst traffic city in the world. Now Sacramento is not without its fair share of traffic and since it has seen a lot of growth in the last decade or so, Sacramento's traffic has increased substantially. However, it is only 25th on the list of worth US cities for traffic and 121st on the world list. So while Sacramento doesn't have barren roads, it is still less congested than both Los Angeles and the Bay Area.
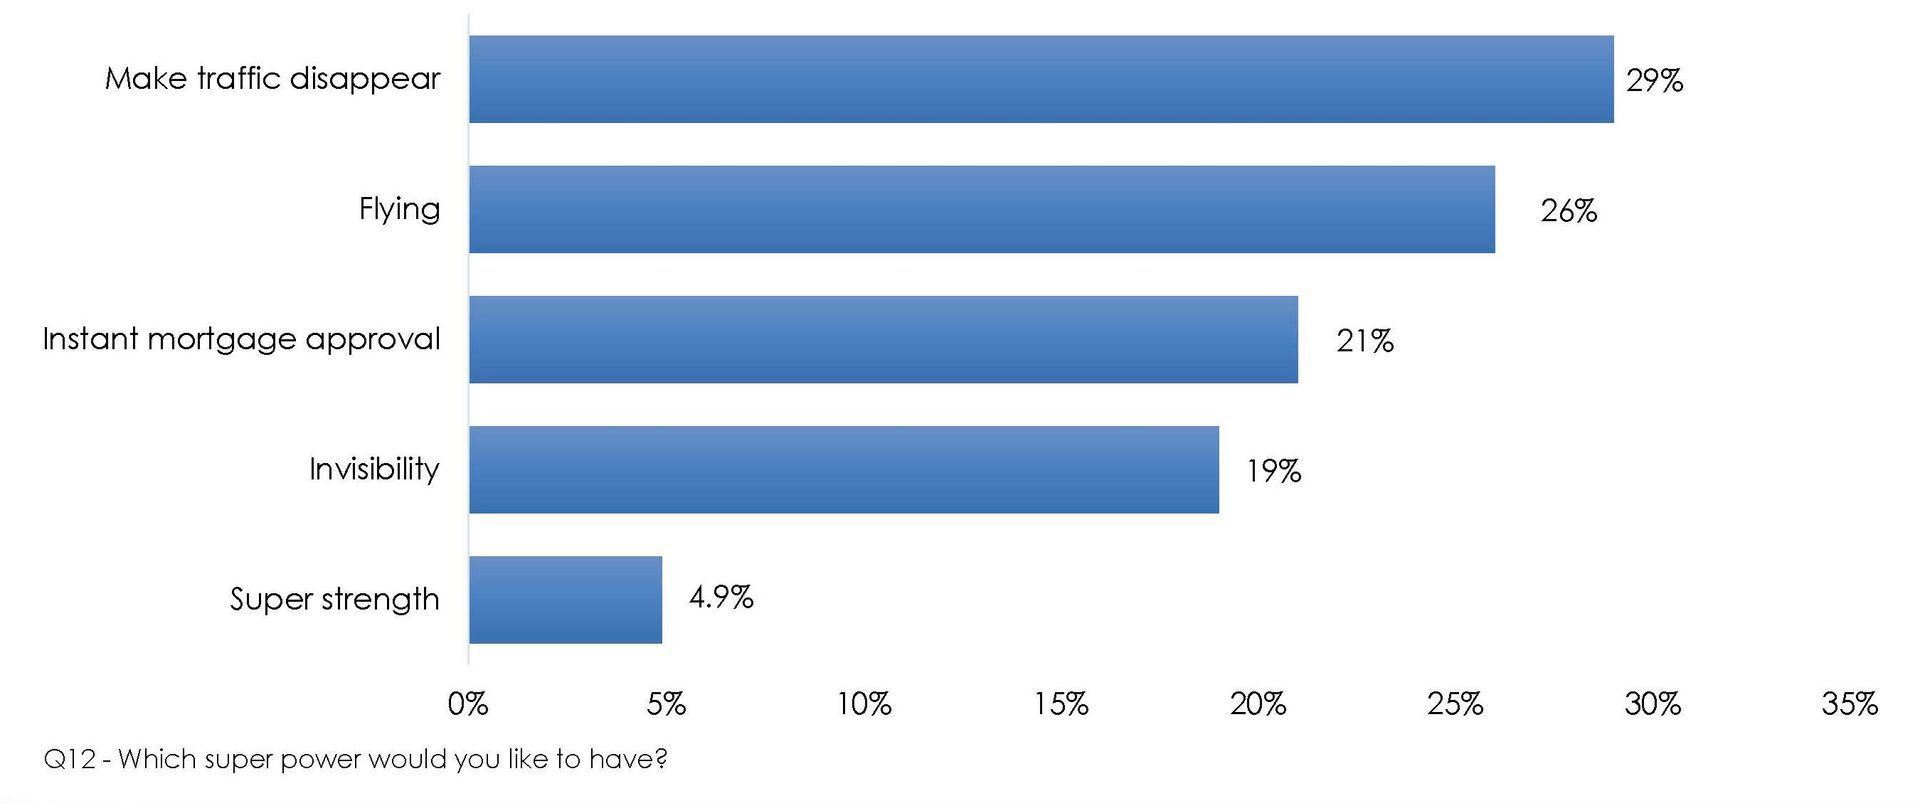
A survey conducted by the California Association of Realtors (C.A.R.) found that most people would choose the super power: make traffic disappear.

SOURCE: CALIFORNIA ASSOCIATION OF REALTORS®


